Cyan Market Intel
Produce: Isaias heads for I-10 while the Northwest gets tighter
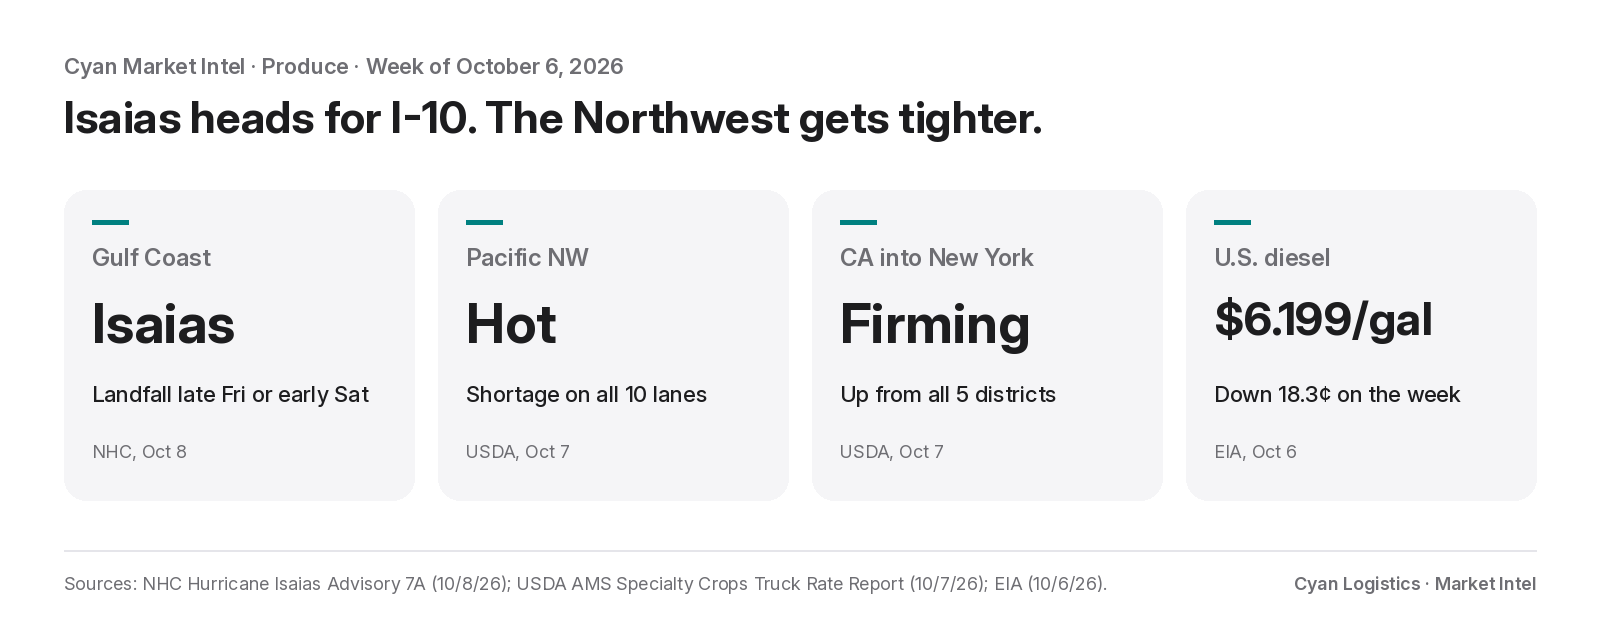
The Gulf storm is now a hurricane. The Pacific Northwest keeps getting tighter.
Hurricane Isaias was up to 85 mph in the southern Gulf late Thursday morning, and the National Hurricane Center expects it to strengthen and come ashore on the northern Gulf Coast late Friday or early Saturday. Hurricane Warnings run from Ocean Springs, Mississippi to the Florida Panhandle, with 3 to 7 inches of rain from southeast Louisiana to the Panhandle and 1 to 3 inches as far north as the Tennessee Valley and the Carolinas. That puts I-10 between New Orleans and Tallahassee, and the corridors north out of Mobile, in the way this weekend.
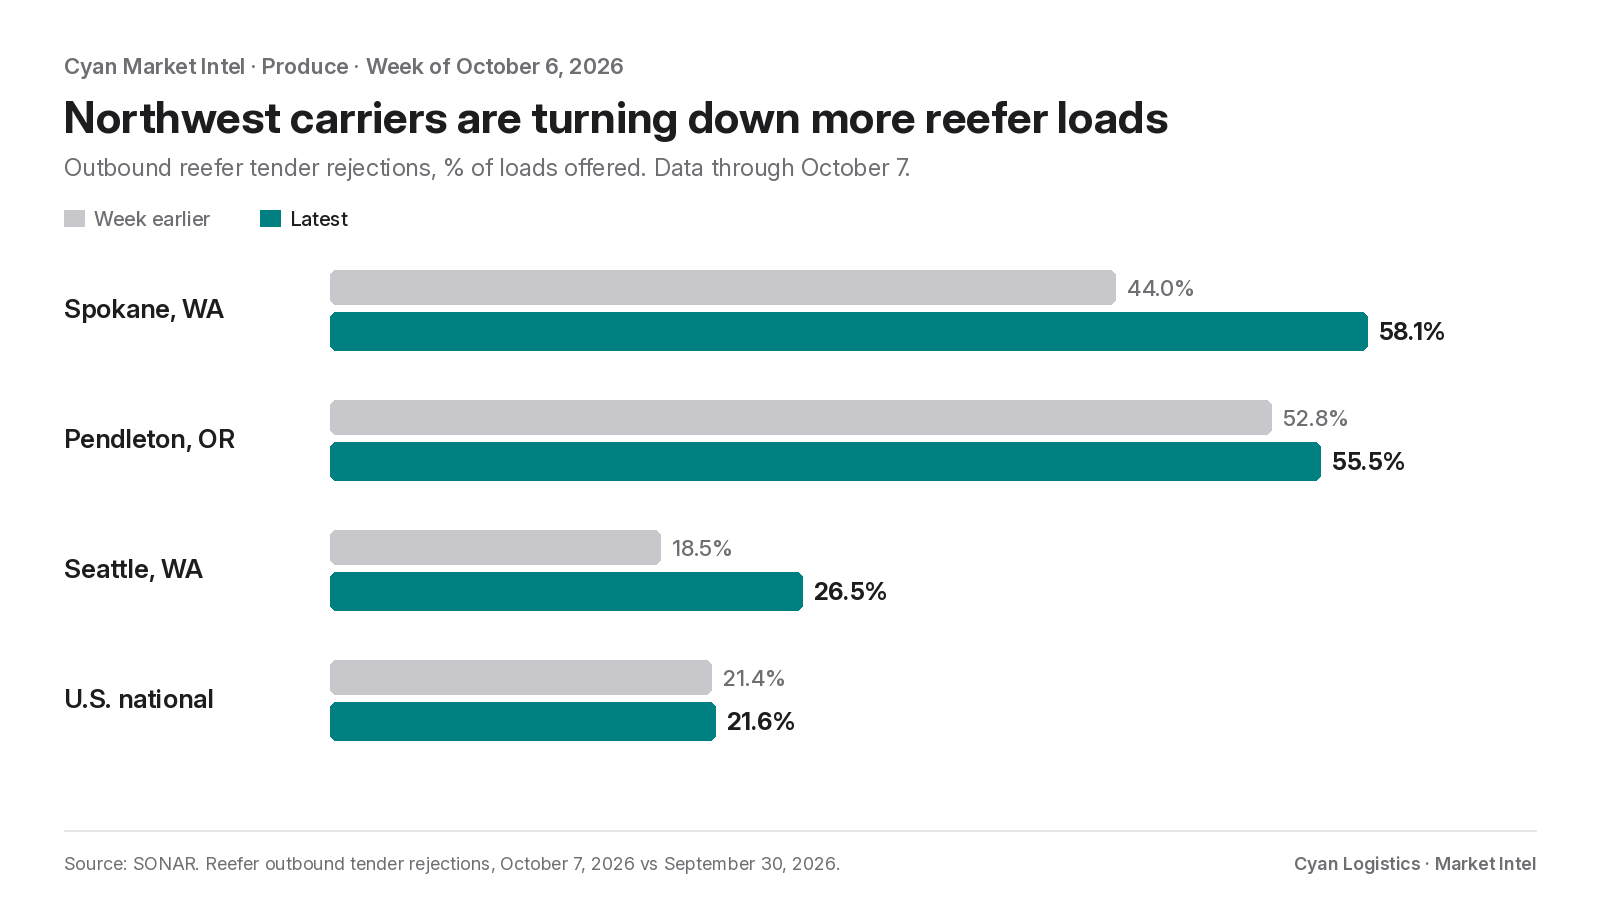
Out west, Yakima and Wenatchee are still listed Shortage on every lane, apple shipments are up again, and carriers keep turning down more loads: Spokane near 58%, Pendleton near 56%, Seattle above 26% (Source: SONAR). National reefer rejections barely moved. This is regional tightness, and it is in apple country.
California split. The run into Chicago cooled in three of five districts, while Salinas jumped. The long haul to New York firmed from every district USDA quotes. South Texas held where it landed last week: rates flat, trucks still tight on four of nine lanes.
Nationally, truck shipments of fresh produce were about even with a year ago for the week ending October 3 (USDA). The national number is calm. The regional pockets are not.
Here’s how it breaks down, district by district.
P6 · Yakima / Wenatchee, WA → Midwest & East
HotShortage holds, and the turn-downs keep climbing.
- Week over week: Flat on the rate tape; USDA printed no change on any of the ten lanes it quotes. Capacity got tighter again. Spokane reefer tender rejections rose 14.1 points to 58.1%, Seattle rose 8.0 points to 26.5%, and Pendleton rose 2.8 points to 55.5% (Source: SONAR, October 7 vs September 30).
- Year over year: No clean district-level read this week.
- Breadth: Shortage on all ten destinations USDA lists, unchanged.
- Volume: 2026-crop Washington apple shipments up again (506, 612, 671 units, exports included), and USDA expects movement to keep increasing seasonally. Pears easing (162, 149, 137).
More than half the reefer loads offered out of Spokane and Pendleton are getting turned down, and the apples keep coming. A cheaper gallon of diesel does not put a reefer in Wenatchee. If you need Midwest or East deliveries out of Washington this month, book early and give carriers more lead time on pickup.
P3 · California → Midwest
FlatChicago split: Salinas jumped, the south gave some back.
- Week over week: Salinas-Watsonville into Chicago +28% and Kern +2% (per USDA). Santa Maria −10%, South and Central California vegetables −9% and Imperial/Coachella/Arizona −9% gave back part of last week’s run. South and Central California citrus flat at Shortage for a second week.
- Year over year: No clean district-level read this week.
- Breadth: 2 of 5 vegetable districts up into Chicago, 3 down. Truck availability Slight Shortage across California vegetable districts, unchanged; citrus Shortage.
- Volume: Salinas iceberg supplies still very light; romaine fairly light. Salinas strawberry shipments fell (215 to 146 units) and are expected to decrease slightly. Oxnard strawberries building seasonally (USDA).
Don’t read the Chicago average and relax. Salinas is where iceberg is very light and strawberry shipments are falling, and that’s the district that jumped. Southern California ran under an Extreme Heat Warning through Thursday evening, and the warning stays up through Friday in the Imperial and Coachella valleys. Heat is when a weak reefer unit fails. Pay for the carrier who holds setpoint and pre-cools.
P4 · California → Northeast
FirmingNew York led the move.
- Week over week: Every California district USDA quotes into New York rose (per USDA): South and Central California vegetables +16%, Kern +11%, Santa Maria +10%, Salinas-Watsonville +9%, Imperial/Coachella/Arizona +3%. Baltimore and Philadelphia were mixed; Salinas-Watsonville eased into both (−8% and −10%).
- Year over year: No clean district-level read this week.
- Breadth: 10 of 17 California vegetable lines into Baltimore, New York and Philadelphia up, 5 down, 2 flat. New York 5 of 5 up, Baltimore 3 of 6, Philadelphia 2 of 6. Truck availability Slight Shortage, unchanged.
- Fuel: California diesel $8.082 a gallon, down 9.9 cents on the week and still about 63% above a year ago (EIA, computed).
Second straight firmer week on the long haul east. If your receivers are in metro New York, plan off this week’s print, not the softer Philadelphia lines.
P2 · McAllen / Laredo, TX → Northeast
FlatRates held. The tighter truck board held too.
- Week over week: Seven of nine destinations unchanged on the rate tape (per USDA); Atlanta +3%, Baltimore +1%. Truck availability unchanged: Los Angeles, Miami, New York and Philadelphia still Slight Shortage; Atlanta, Baltimore, Boston, Chicago and Dallas still Slight Surplus. Laredo reefer tender rejections 5.5%, up from 2.6% a week earlier (Source: SONAR).
- Year over year: No clean district-level read this week.
- Breadth: 2 of 9 destinations up, none down, 7 flat.
- Volume: Mexican bell pepper crossings through Texas eased after last week’s jump, and USDA expects them to decrease. Tomato crossings fell and are expected to ease slightly; limes, broccoli and cucumbers up. Watermelon harvest curtailed by heavy rain and wet fields.
A flat week with the truck board still tight means last week’s tightening stuck. Fewer cross-border drivers are available after B-1 visa withdrawals (C.H. Robinson, October 1). The bigger risk this week is Isaias. Northeast loads that run through Louisiana, Mississippi or Alabama Friday through Sunday should carry a day of slack on delivery.
P1 · Nogales / Arizona → Midwest
FlatThe season is still getting started.
- Week over week: USDA’s desert bundle (Imperial/Coachella, Central and Western Arizona, Calexico and San Luis crossings) eased into Chicago −9% after last week’s gain. Up into Seattle +8%, Dallas +6%, Atlanta +3%, New York +3% and Boston +1%; Miami −2%; Baltimore and Philadelphia flat. Standalone Nogales: no clean read on the truck report.
- Year over year: No clean district-level read this week.
- Breadth: 5 of 9 destinations up, 2 down, 2 flat. Truck availability Slight Shortage, unchanged.
- Volume: Nogales cucumber crossings picked up (31 to 44 units); squash, honeydew and watermelon still too light to set a market. First USDA price reports expected the weeks of October 11 (cucumbers, squash) and October 18 (honeydew, watermelon).
Not a breakout, and Chicago gave back ground. The volume is coming, though. An Extreme Heat Warning covers Imperial, Coachella and Yuma through Friday. Ask your carrier about pre-cool and continuous-run settings on squash and melons.
P5 · Florida → East Coast / Midwest
No USDA truck read this week. Florida is not on the truck board until its fall deal gets going; Central and South Florida cucumbers are just starting (0, 5, 8 units), with first USDA price reports expected the week of October 11. Lakeland reefer tender rejections eased to 2.4% (Source: SONAR). The risk is weather, not capacity: Isaias brings hurricane conditions to the Panhandle Friday night, a tornado threat into north Florida and Georgia Saturday, and heavy rain across the Southeast. Loads heading north on I-75 or I-95 this weekend may run slow.
Fuel: the number under every lane
No new diesel print since Tuesday. EIA’s next update is October 14.
EIA’s national on-highway diesel average printed $6.199 a gallon for the week of October 5, down 18.3 cents from $6.382. Second straight weekly drop. A year ago it was $3.711, so diesel is still about 67% higher.
Every printed region fell, including Rocky Mountain (down 14.0 cents to $6.267). Lower Atlantic fell most, 25.4 cents to $5.699. Midwest fell 24.0 cents to $6.286. The Northeast barely moved: New England down 3.4 cents to $6.476, Central Atlantic down 4.6 cents to $6.485. California dipped 9.9 cents to $8.082 and is still the expensive outlier.
Reset fuel tables to the October 5 print. And don’t read two weeks of cheaper diesel as a soft market. SONAR’s weekly outlook says carriers are still able to pass rising costs through and are pushing double-digit increases into 2027 contract bids (Source: SONAR).
What this means for shippers this week
- Gulf Coast and Southeast: line up another routing and build in a day. Isaias is forecast to make landfall late Friday or early Saturday with hurricane-force winds from coastal Mississippi to the Florida Panhandle and flooding rain into the Southeast. Anything crossing I-10 or running north out of Mobile Friday through Sunday needs slack on delivery and a carrier who will tell you early if they’re holding. NHC also expects damaging gusts inland across central and northern Alabama and western and northern Georgia, and advises against driving high-profile vehicles there.
- Washington apples and pears: budget and book early. Shortage on every lane, rejections climbed again, and apple shipments are still rising. Fuel relief does not create trucks in the valley.
- California into Chicago: watch Salinas and protect shelf life. The average cooled, but Salinas jumped with iceberg very light and strawberry shipments falling. Pay for pre-cool and a unit that holds setpoint; a temperature excursion costs more than the linehaul.
- California to the Northeast: book New York early. Every district into New York was up. Plan off that, not the softer Philadelphia lines.
- South Texas and Mexico crossings: hold steady and lock capacity. Rates flat, truck board still tight on four of nine lanes. Routes through Louisiana, Mississippi and Alabama carry storm risk this weekend.
- Florida: watch the weather. No capacity squeeze, but Isaias can slow pickups and northbound runs through the weekend.
- Everywhere: keep fuel on the October 5 EIA print. $6.199 U.S. and $8.082 California until EIA updates October 14. Expect carriers to hold the line on contract rates anyway.
Not sure which of your lanes carries the most risk this week? Run it through our lane check.
Todd Cunningham · Cyan Logistics
Freight broker specializing in refrigerated freight, authorized agent of D&L Transport, MC#512088. 14,000+ vetted carriers, shipping to all lower 48 states.
If your lane is moving differently than what’s above, reach Alex at alex@cyanlogistics.net or (909) 972-1006.
Sources
- USDA AMS Specialty Crops National Truck Rate Report (FVWTRK), report dated October 7, 2026; data for Tuesday, October 6, 2026, with % change from Tuesday, September 29, 2026 (truck availability, per-destination week-over-week %, page 6 truck shipments chart for weeks ending October 3, 2026 and October 4, 2025). https://www.ams.usda.gov/mnreports/fvwtrk.pdf
- USDA AMS National Shipping Point Trends (FVWTRDS), dated October 6, 2026; shipments and crossings for weeks ending September 19, September 26 and October 3, 2026; expected movement October 4–17, 2026. Volume and movement notes only. https://www.ams.usda.gov/mnreports/fvwtrds.pdf
- U.S. EIA Gasoline and Diesel Fuel Update, diesel release October 6, 2026; week of 10/05/26; next release October 14, 2026. U.S. and regional on-highway diesel with week-ago and year-ago change. https://www.eia.gov/petroleum/gasdiesel/
- FreightWaves SONAR, reefer tender rejections (Seattle, Pendleton, Spokane, Laredo, Lakeland) and national reefer rejections, data through October 7, 2026, compared with September 30, 2026; SONAR Weekly Outlook, October 4, 2026. Source: SONAR.
- National Hurricane Center, Hurricane Isaias Advisory 8 and Discussion 8 (10:00 AM CDT, October 8, 2026). https://www.nhc.noaa.gov/
- National Weather Service, active alerts as of October 8, 2026: Extreme Heat Warnings (Southern California through October 8; Imperial, Coachella and Yuma through October 9), Flood Watches (Florida Panhandle, southeast Alabama, southwest Georgia). https://www.weather.gov/
- C.H. Robinson, North America Freight Insights: Cross-Border (October 2026 update), dated October 1, 2026; B-1 visa withdrawals shrinking the cross-border driver pool. https://www.chrobinson.com/en-au/resources/insights-and-advisories/north-america-freight-insights/oct-2026-freight-market-update/cross-border/